

How to use this Website
Click on these links to return to our home page or statistics page. To view a video on how to use this website, please watch this demo video.
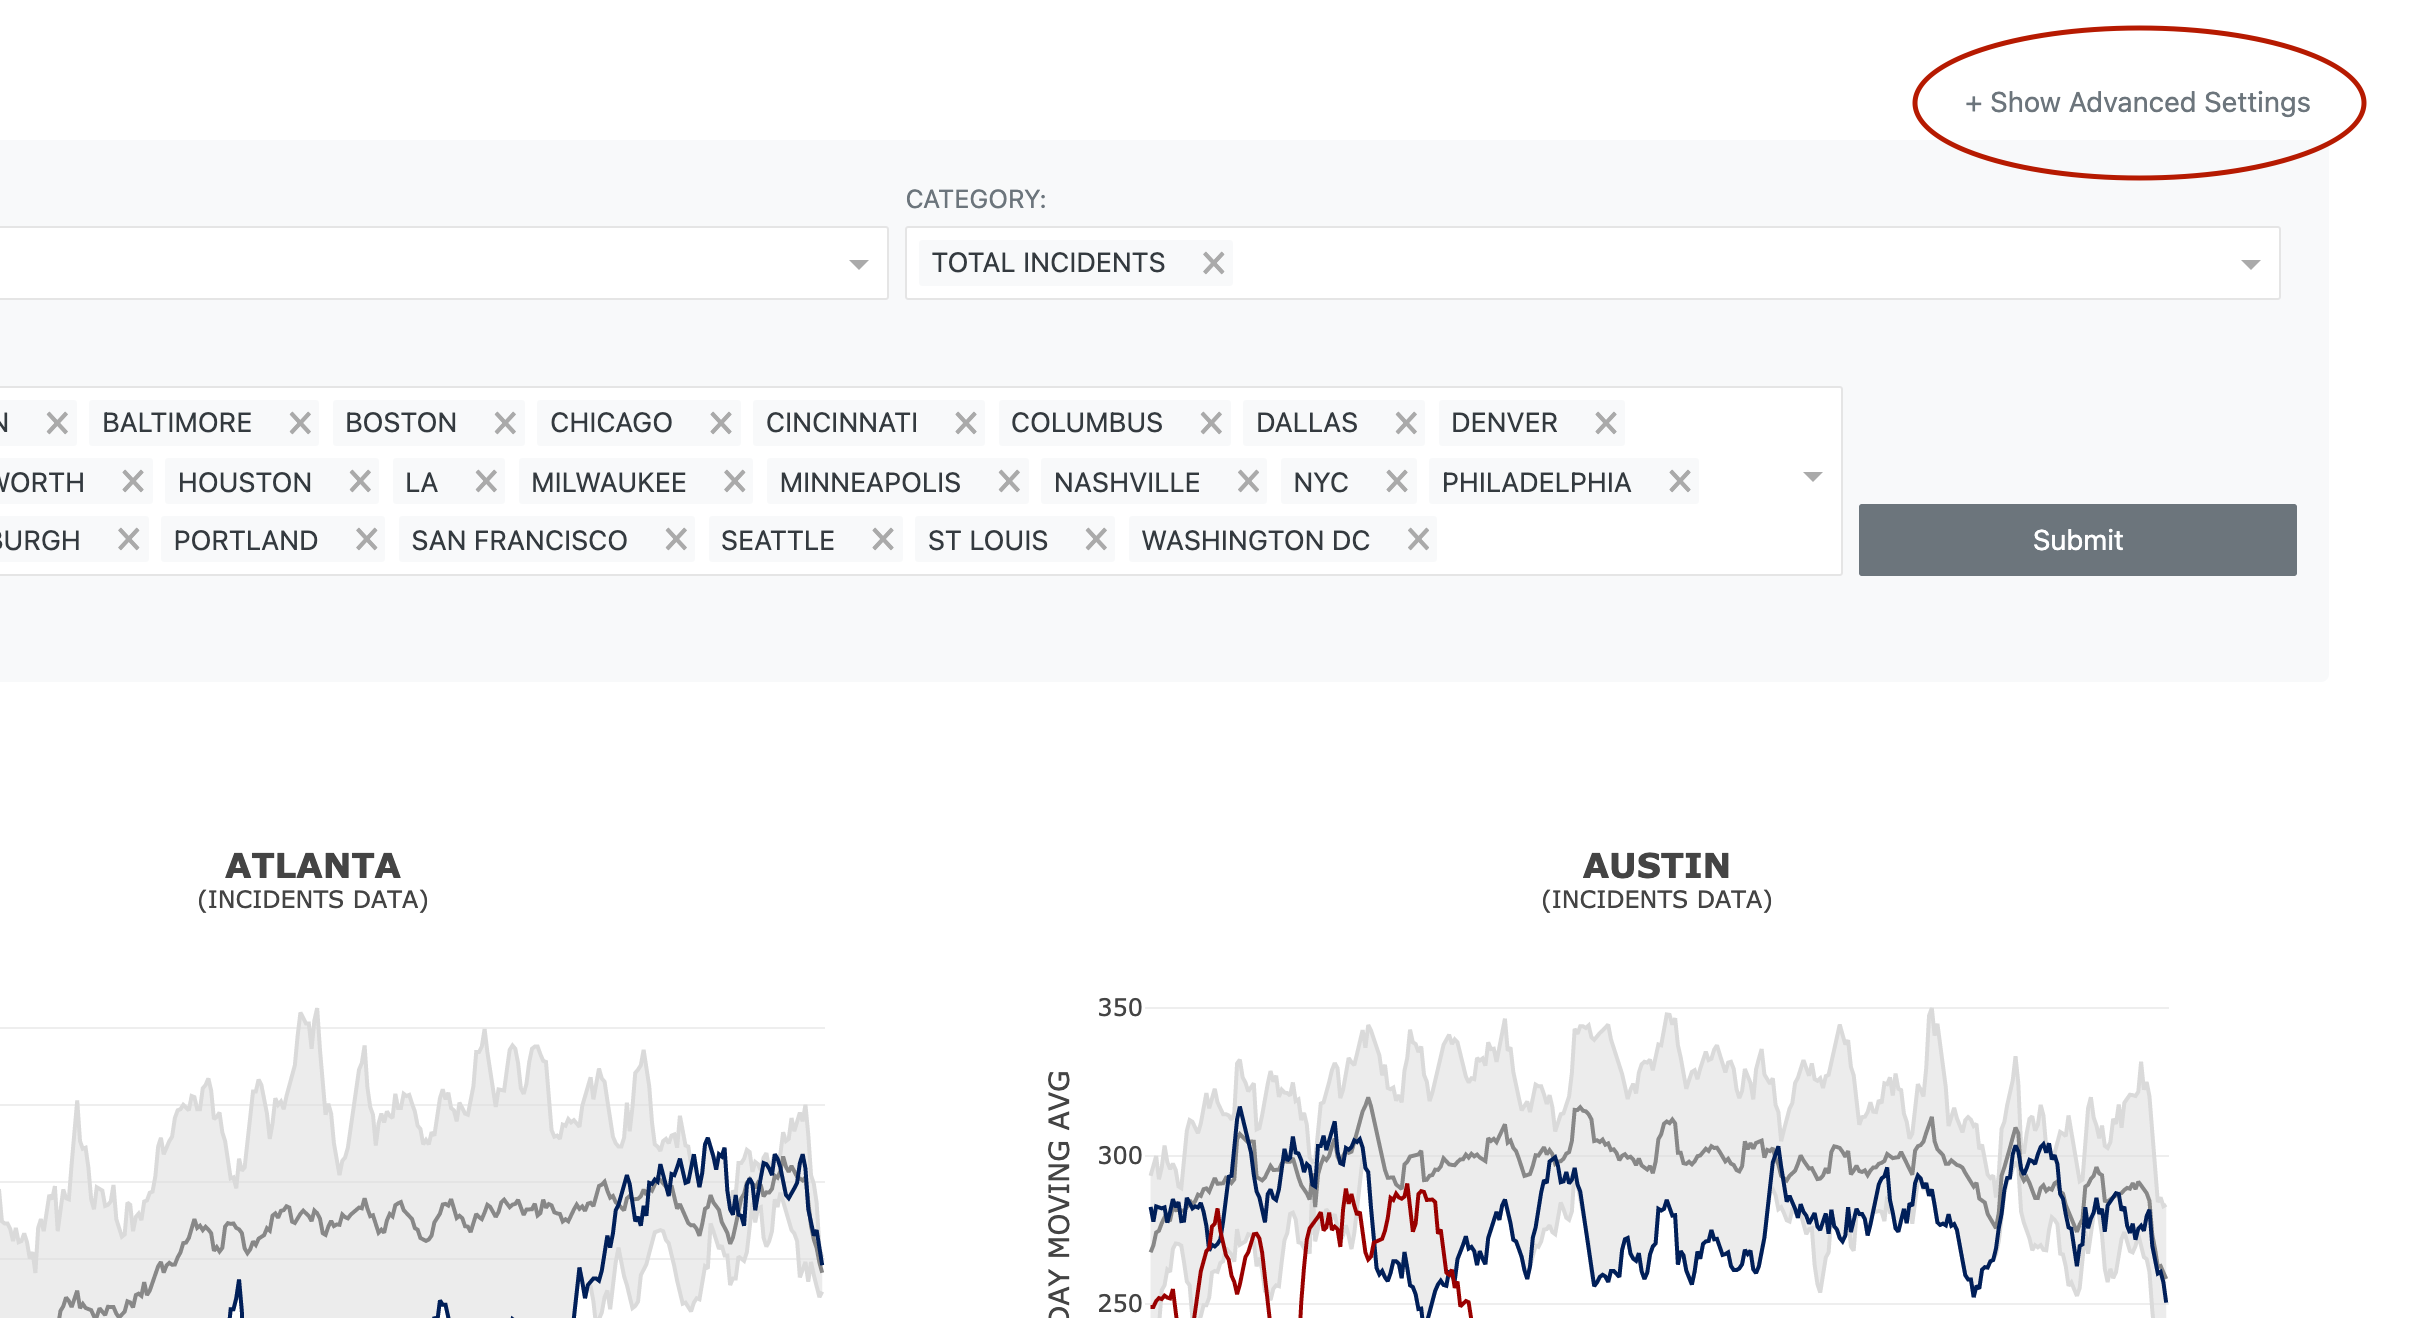
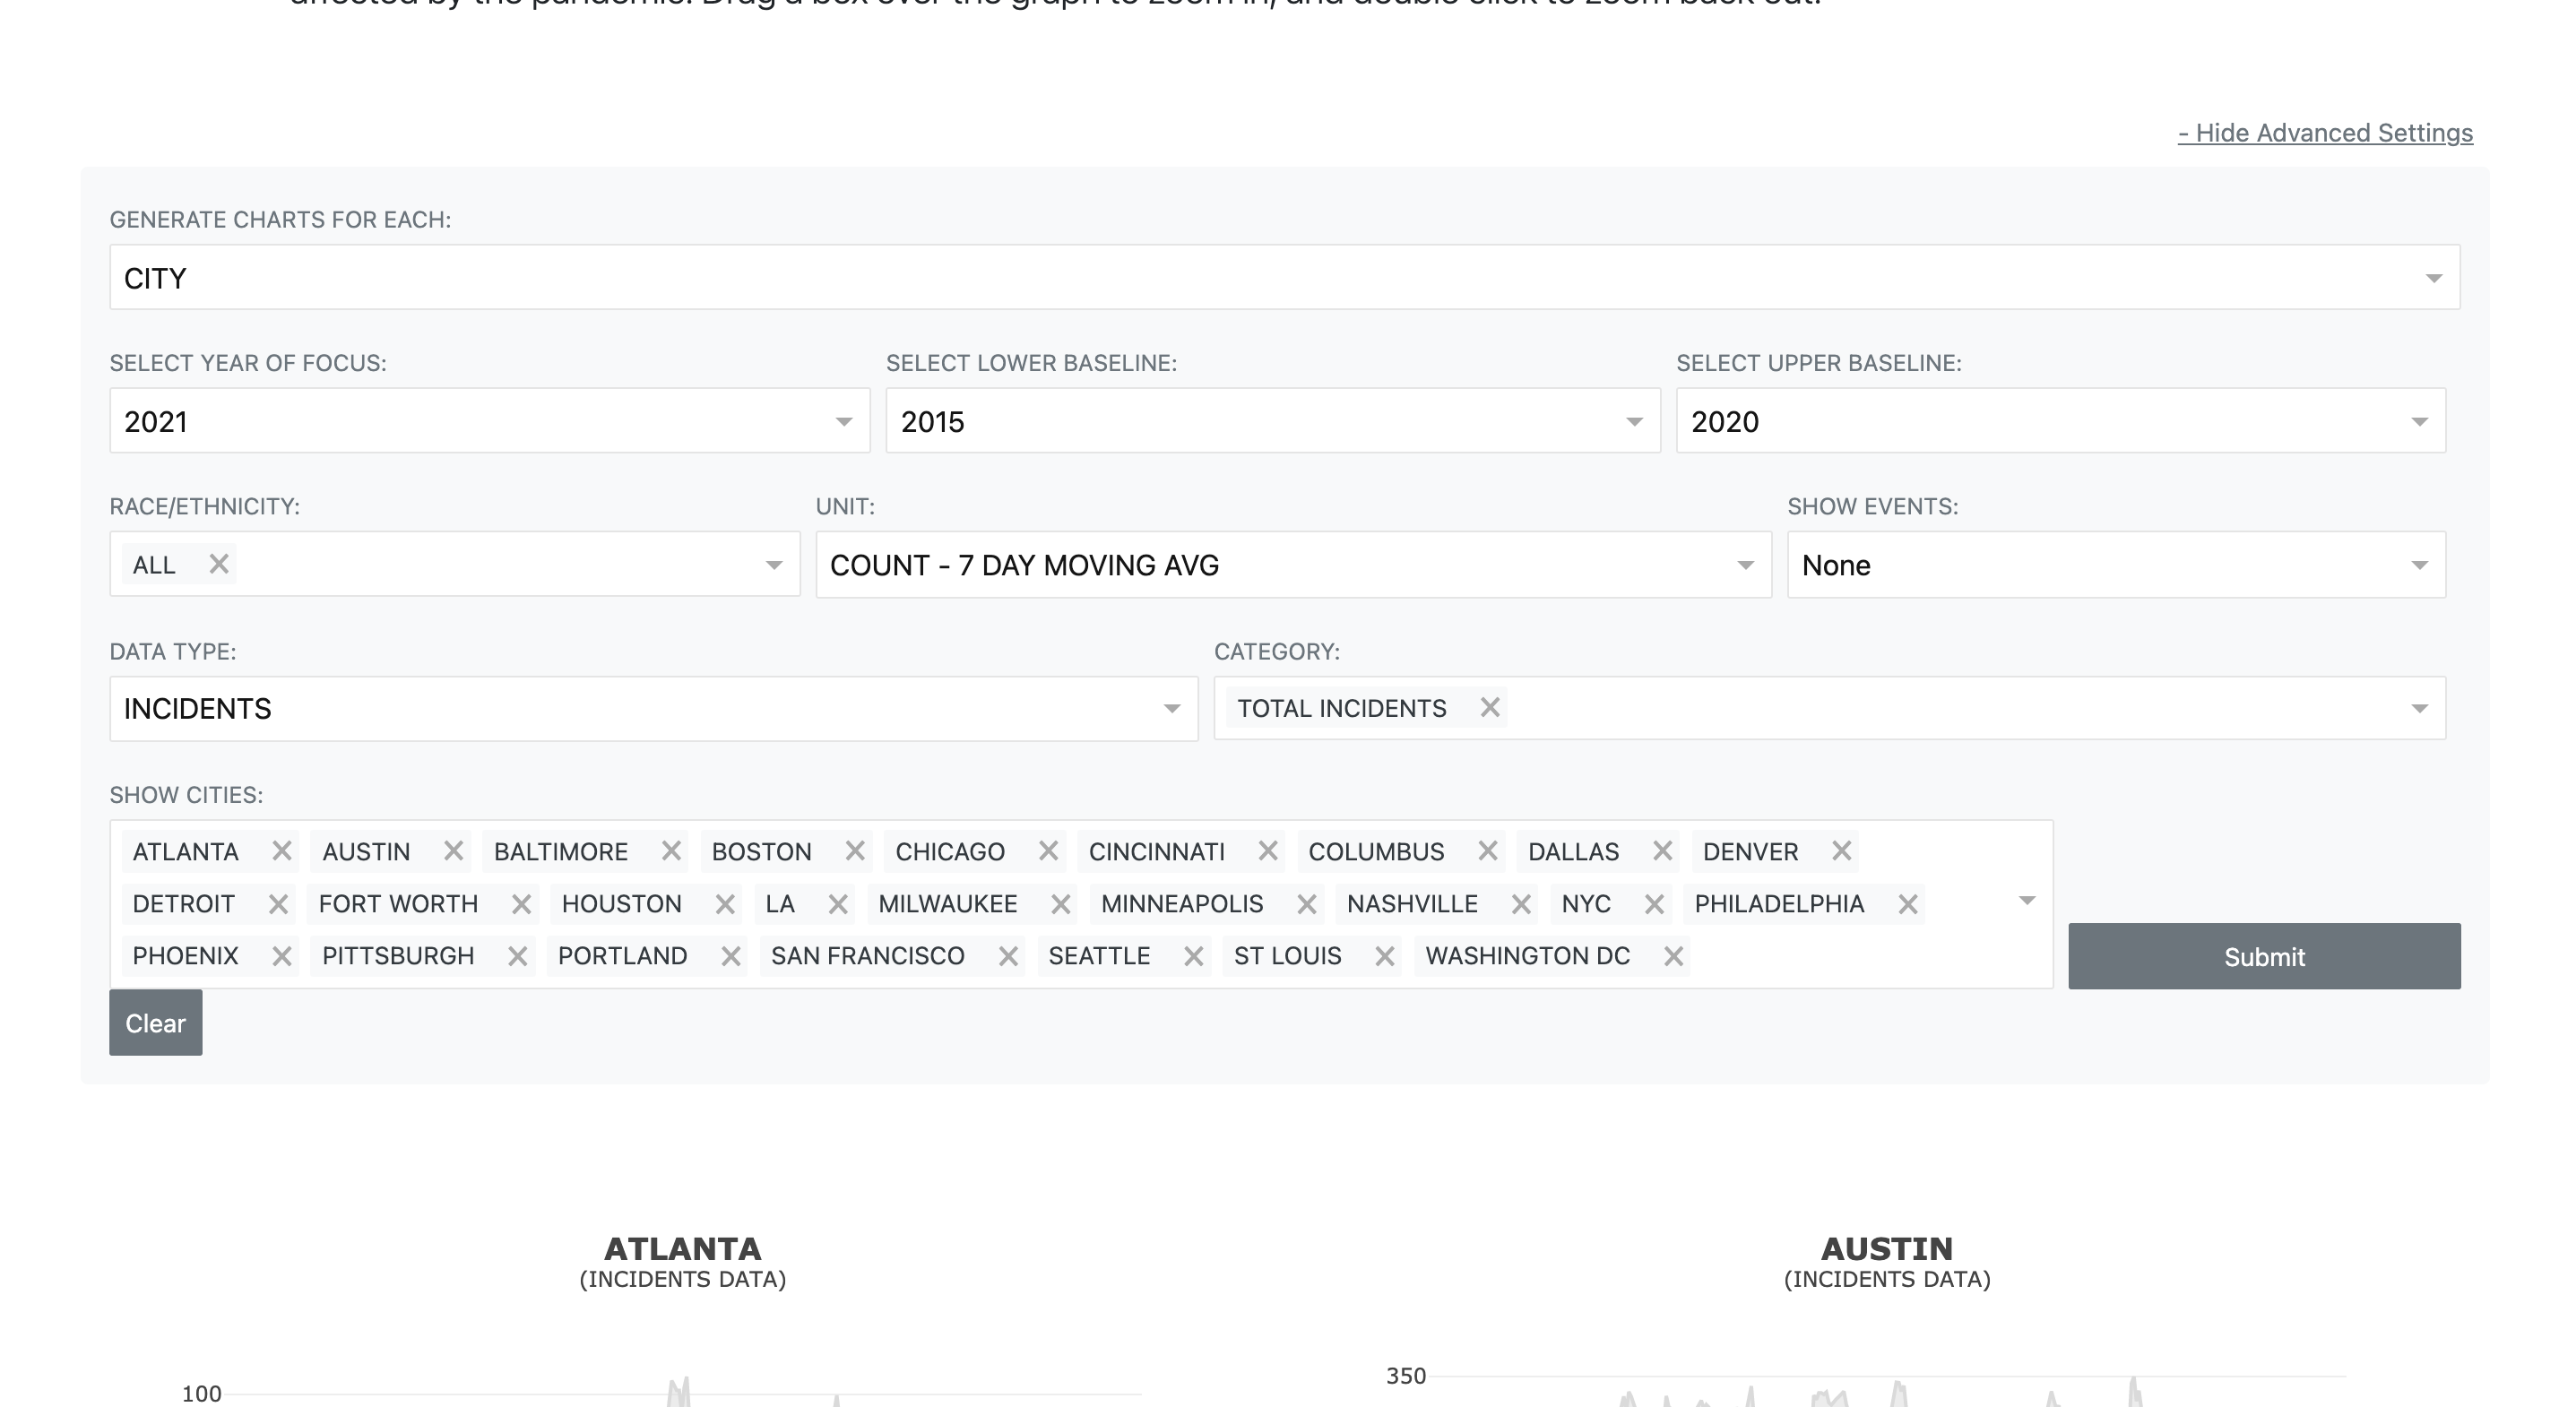
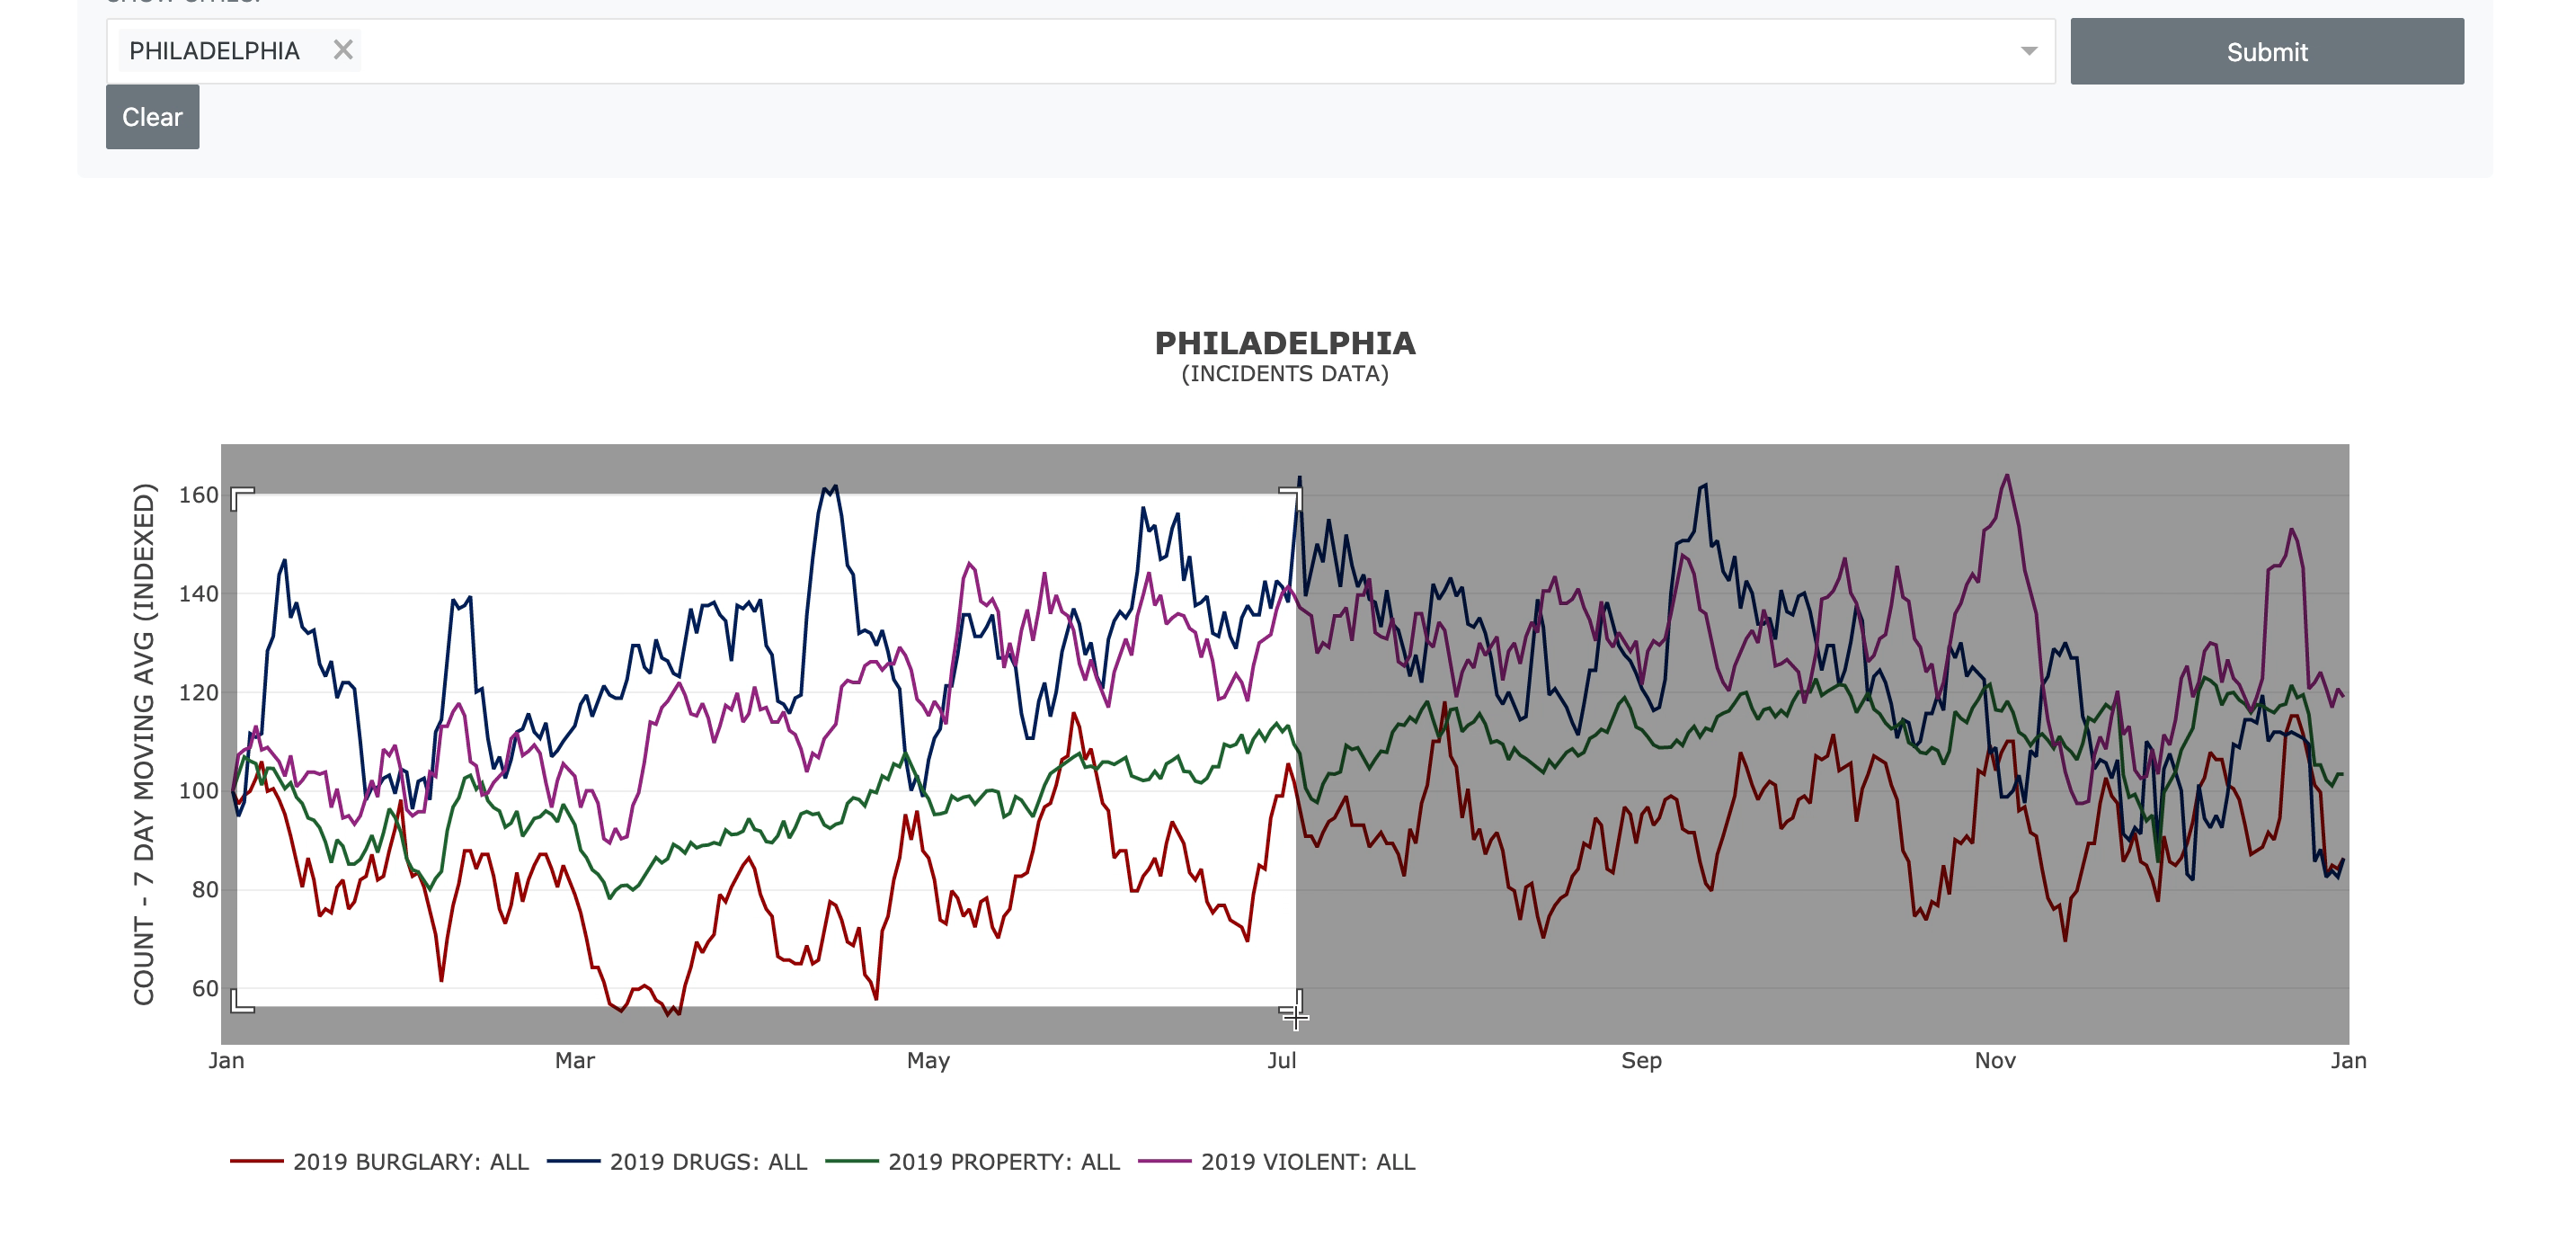
Our home page will automatically load crime data from 2020 and the current year, plotting the data for each city, with different lines representing different types of crime. There are a number of filters that can be used to narrow down the data. Clicking on advanced settings will allow you to specify a baseline year range and a year of focus, as well as exposing various other filters. To clear all cities and select just one, simply click the "Clear" button under the drop down. To select all the cities, you can click the "Clear" button first, and then you can click the "All Cities" button.
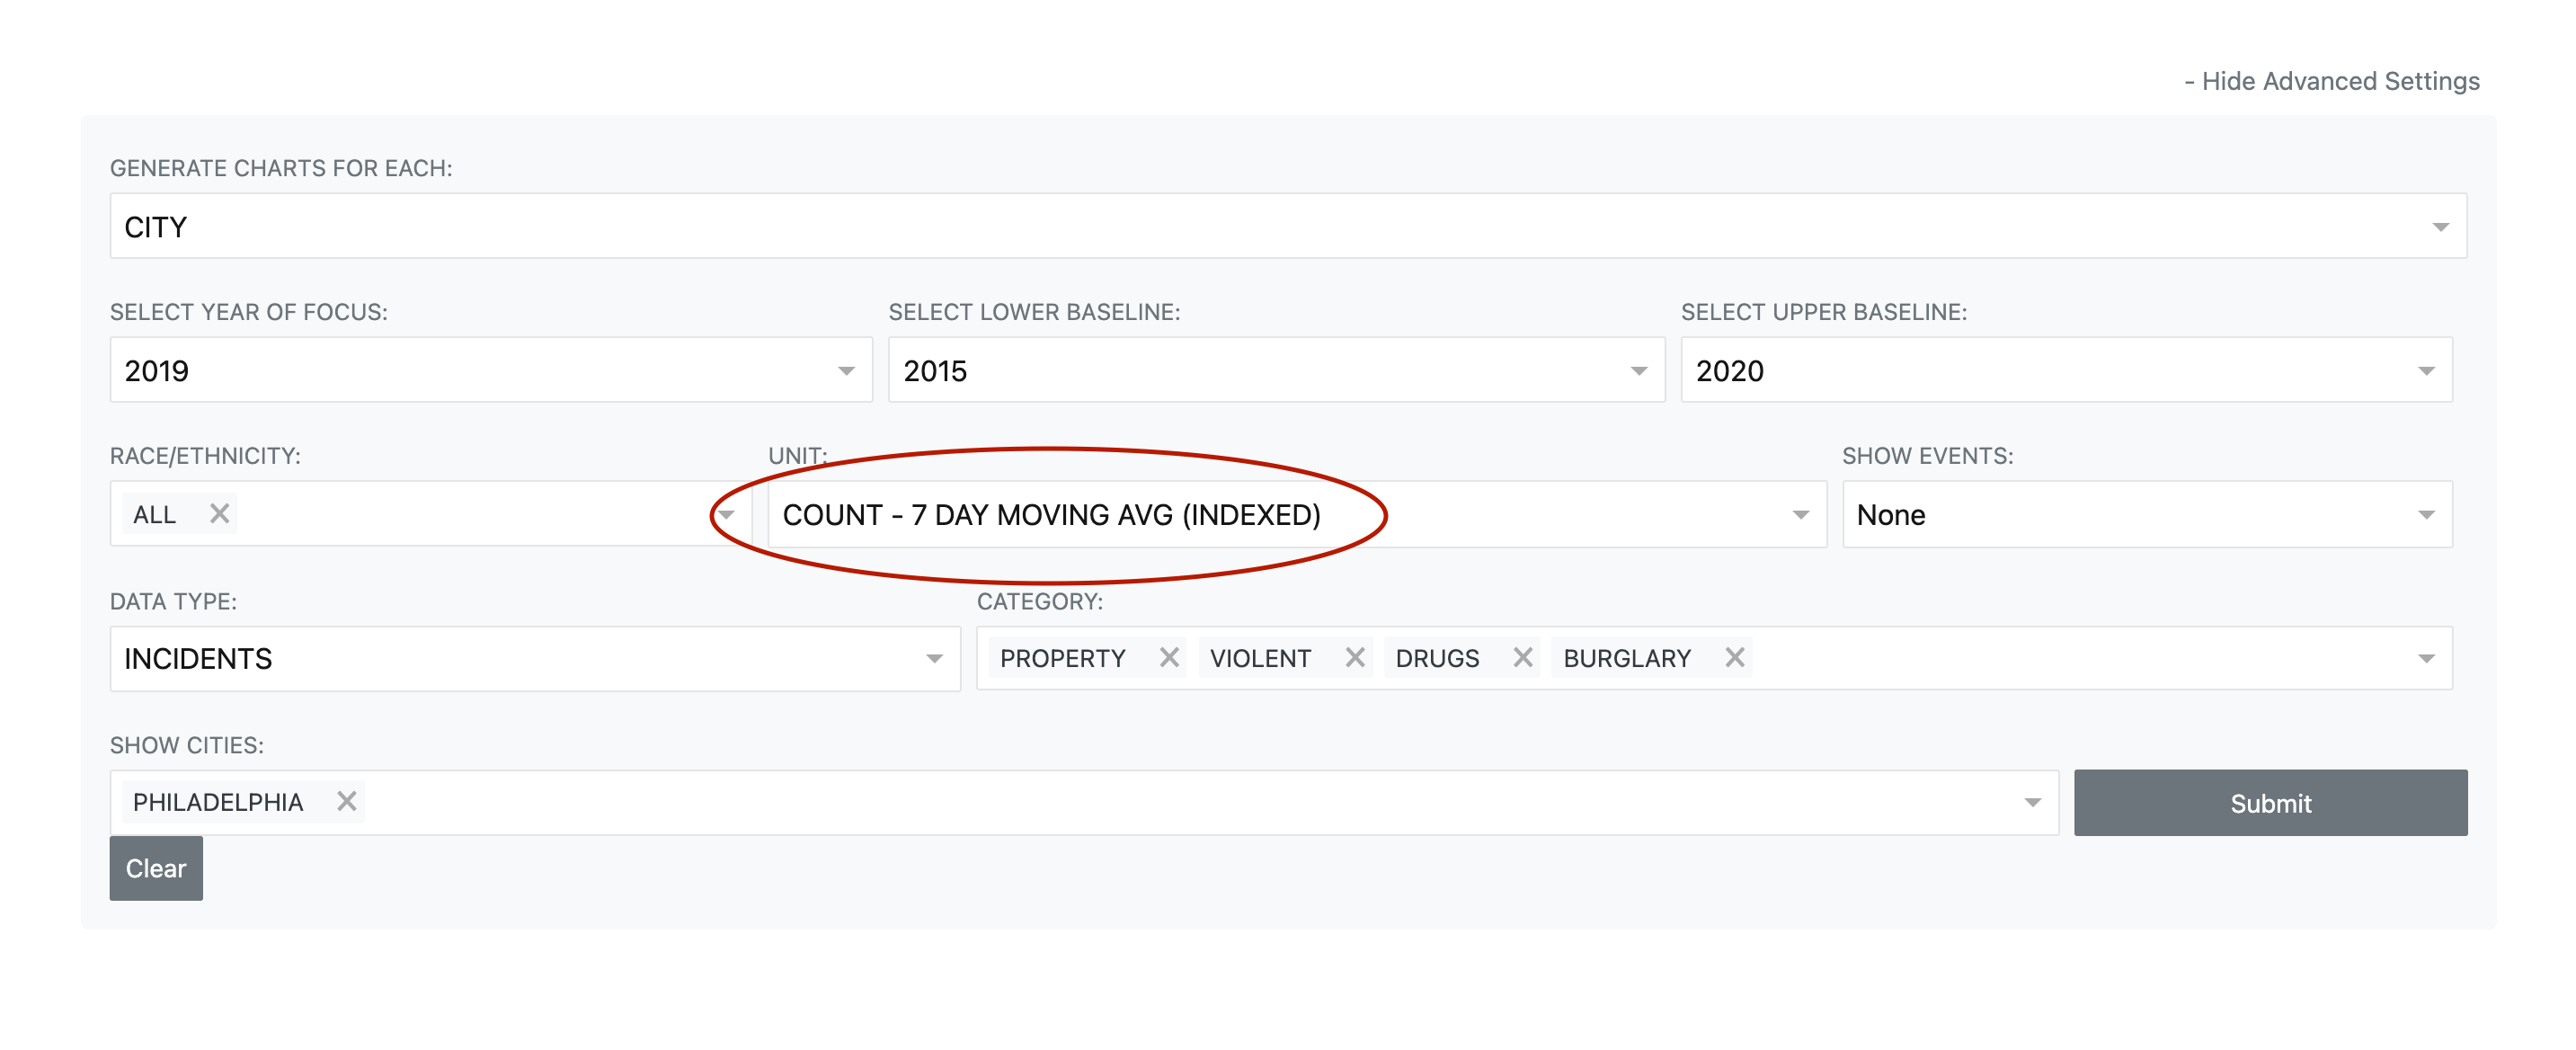
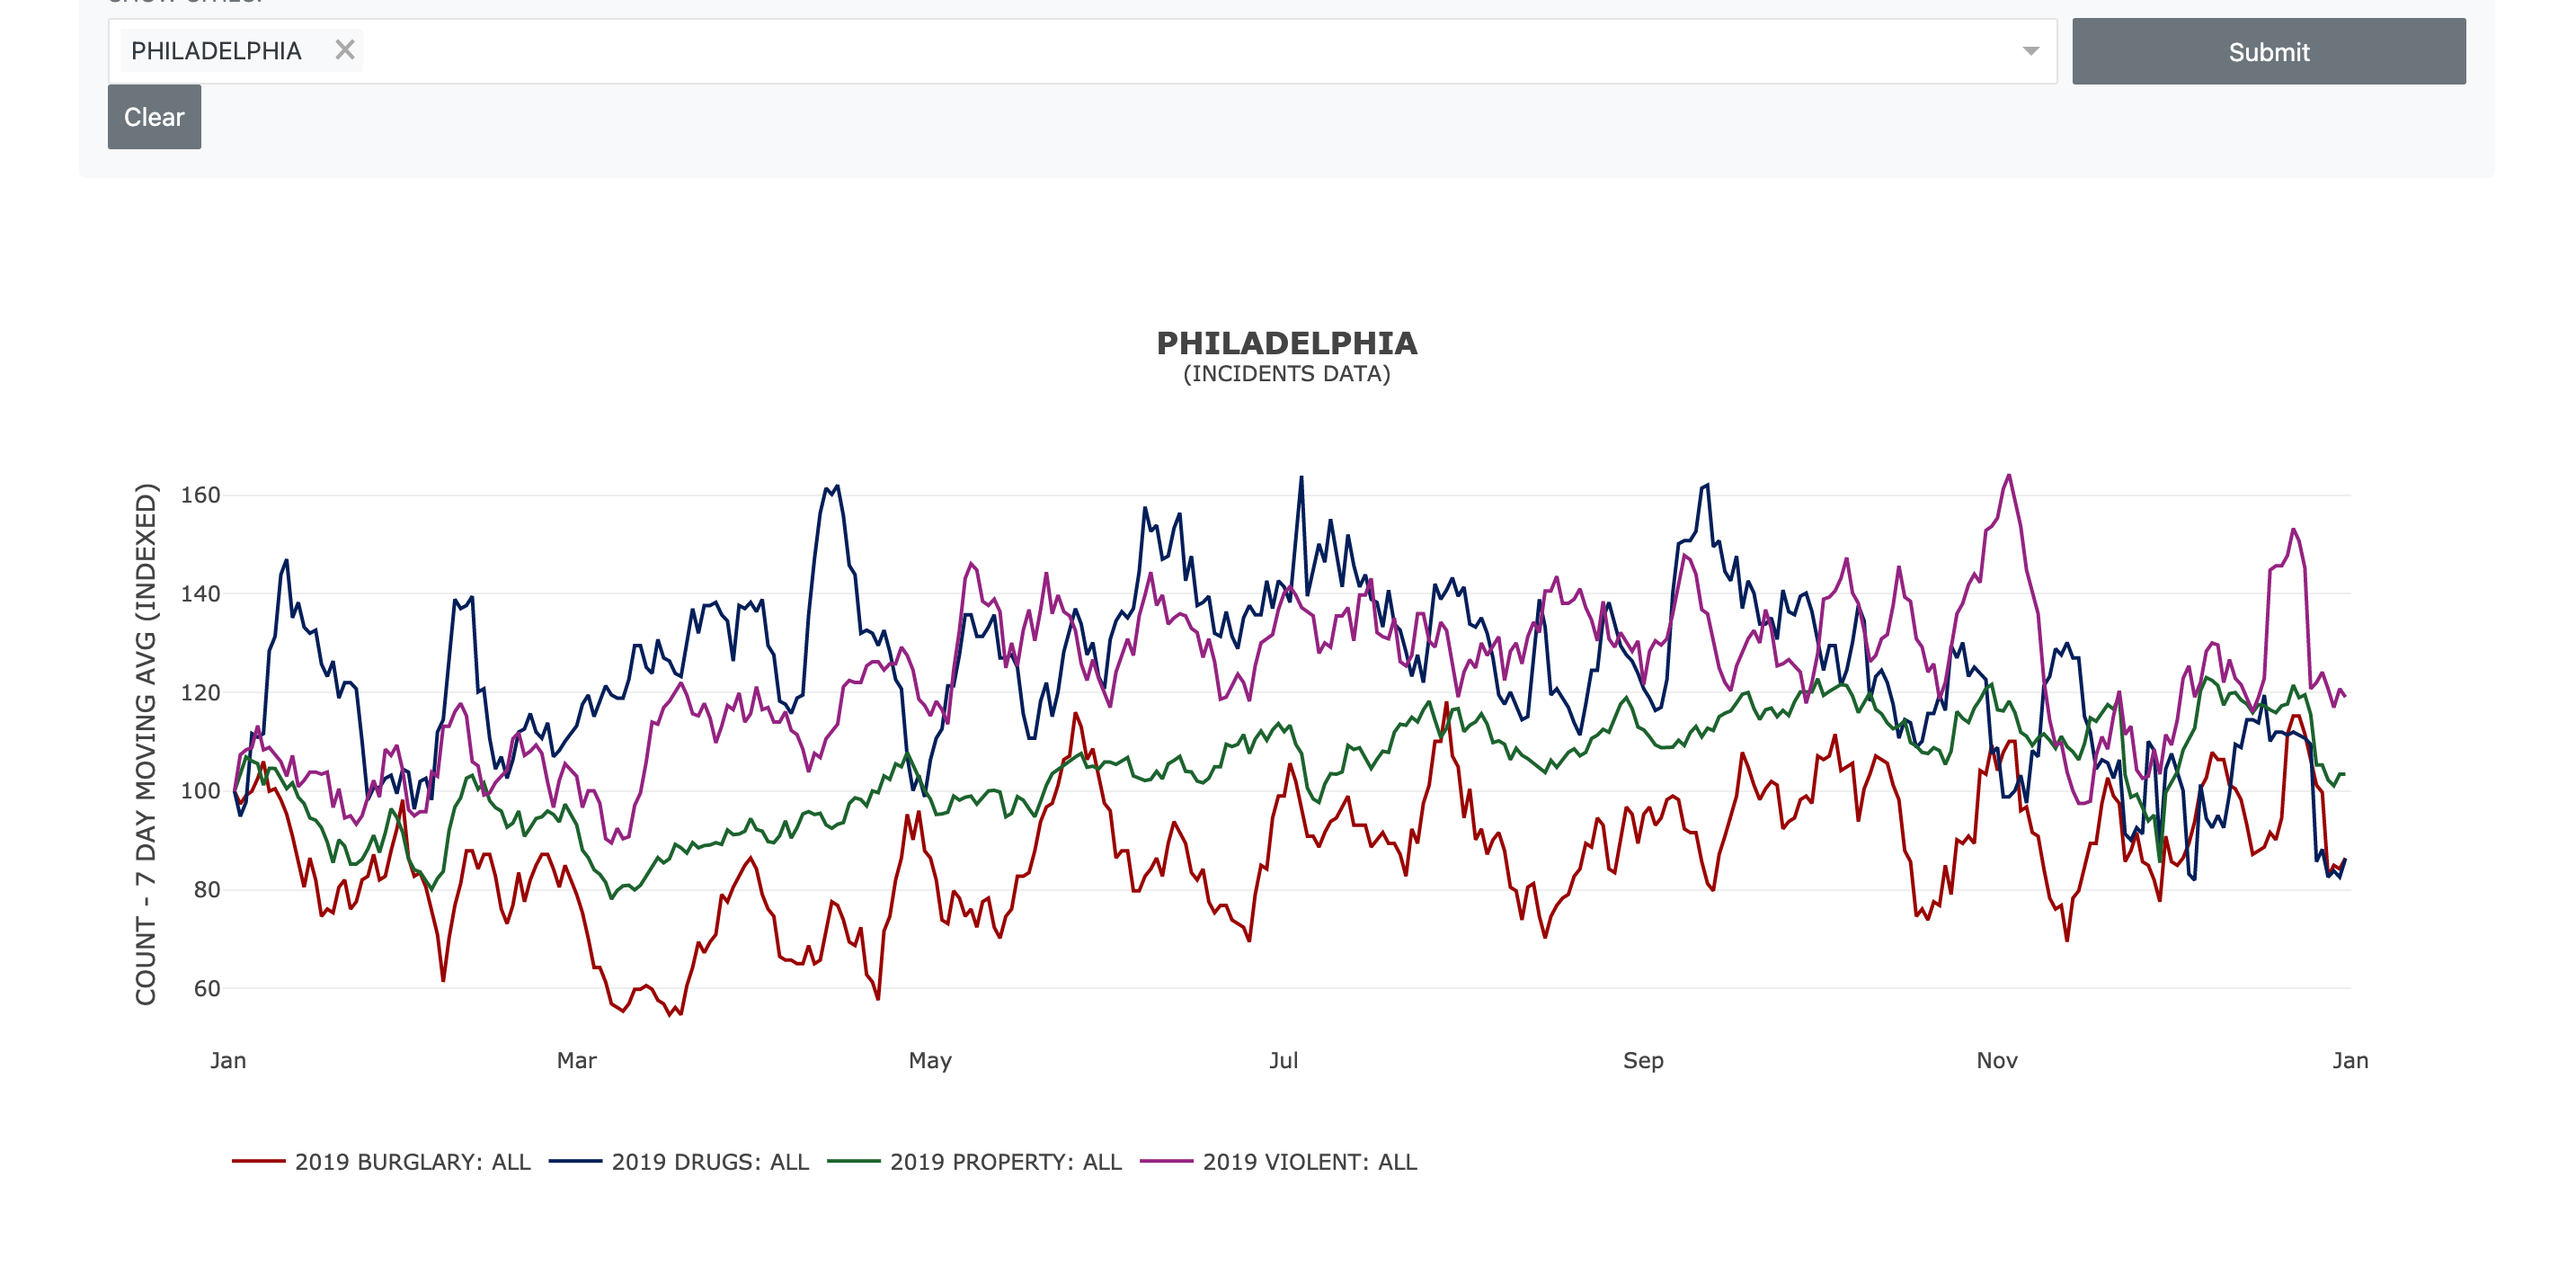
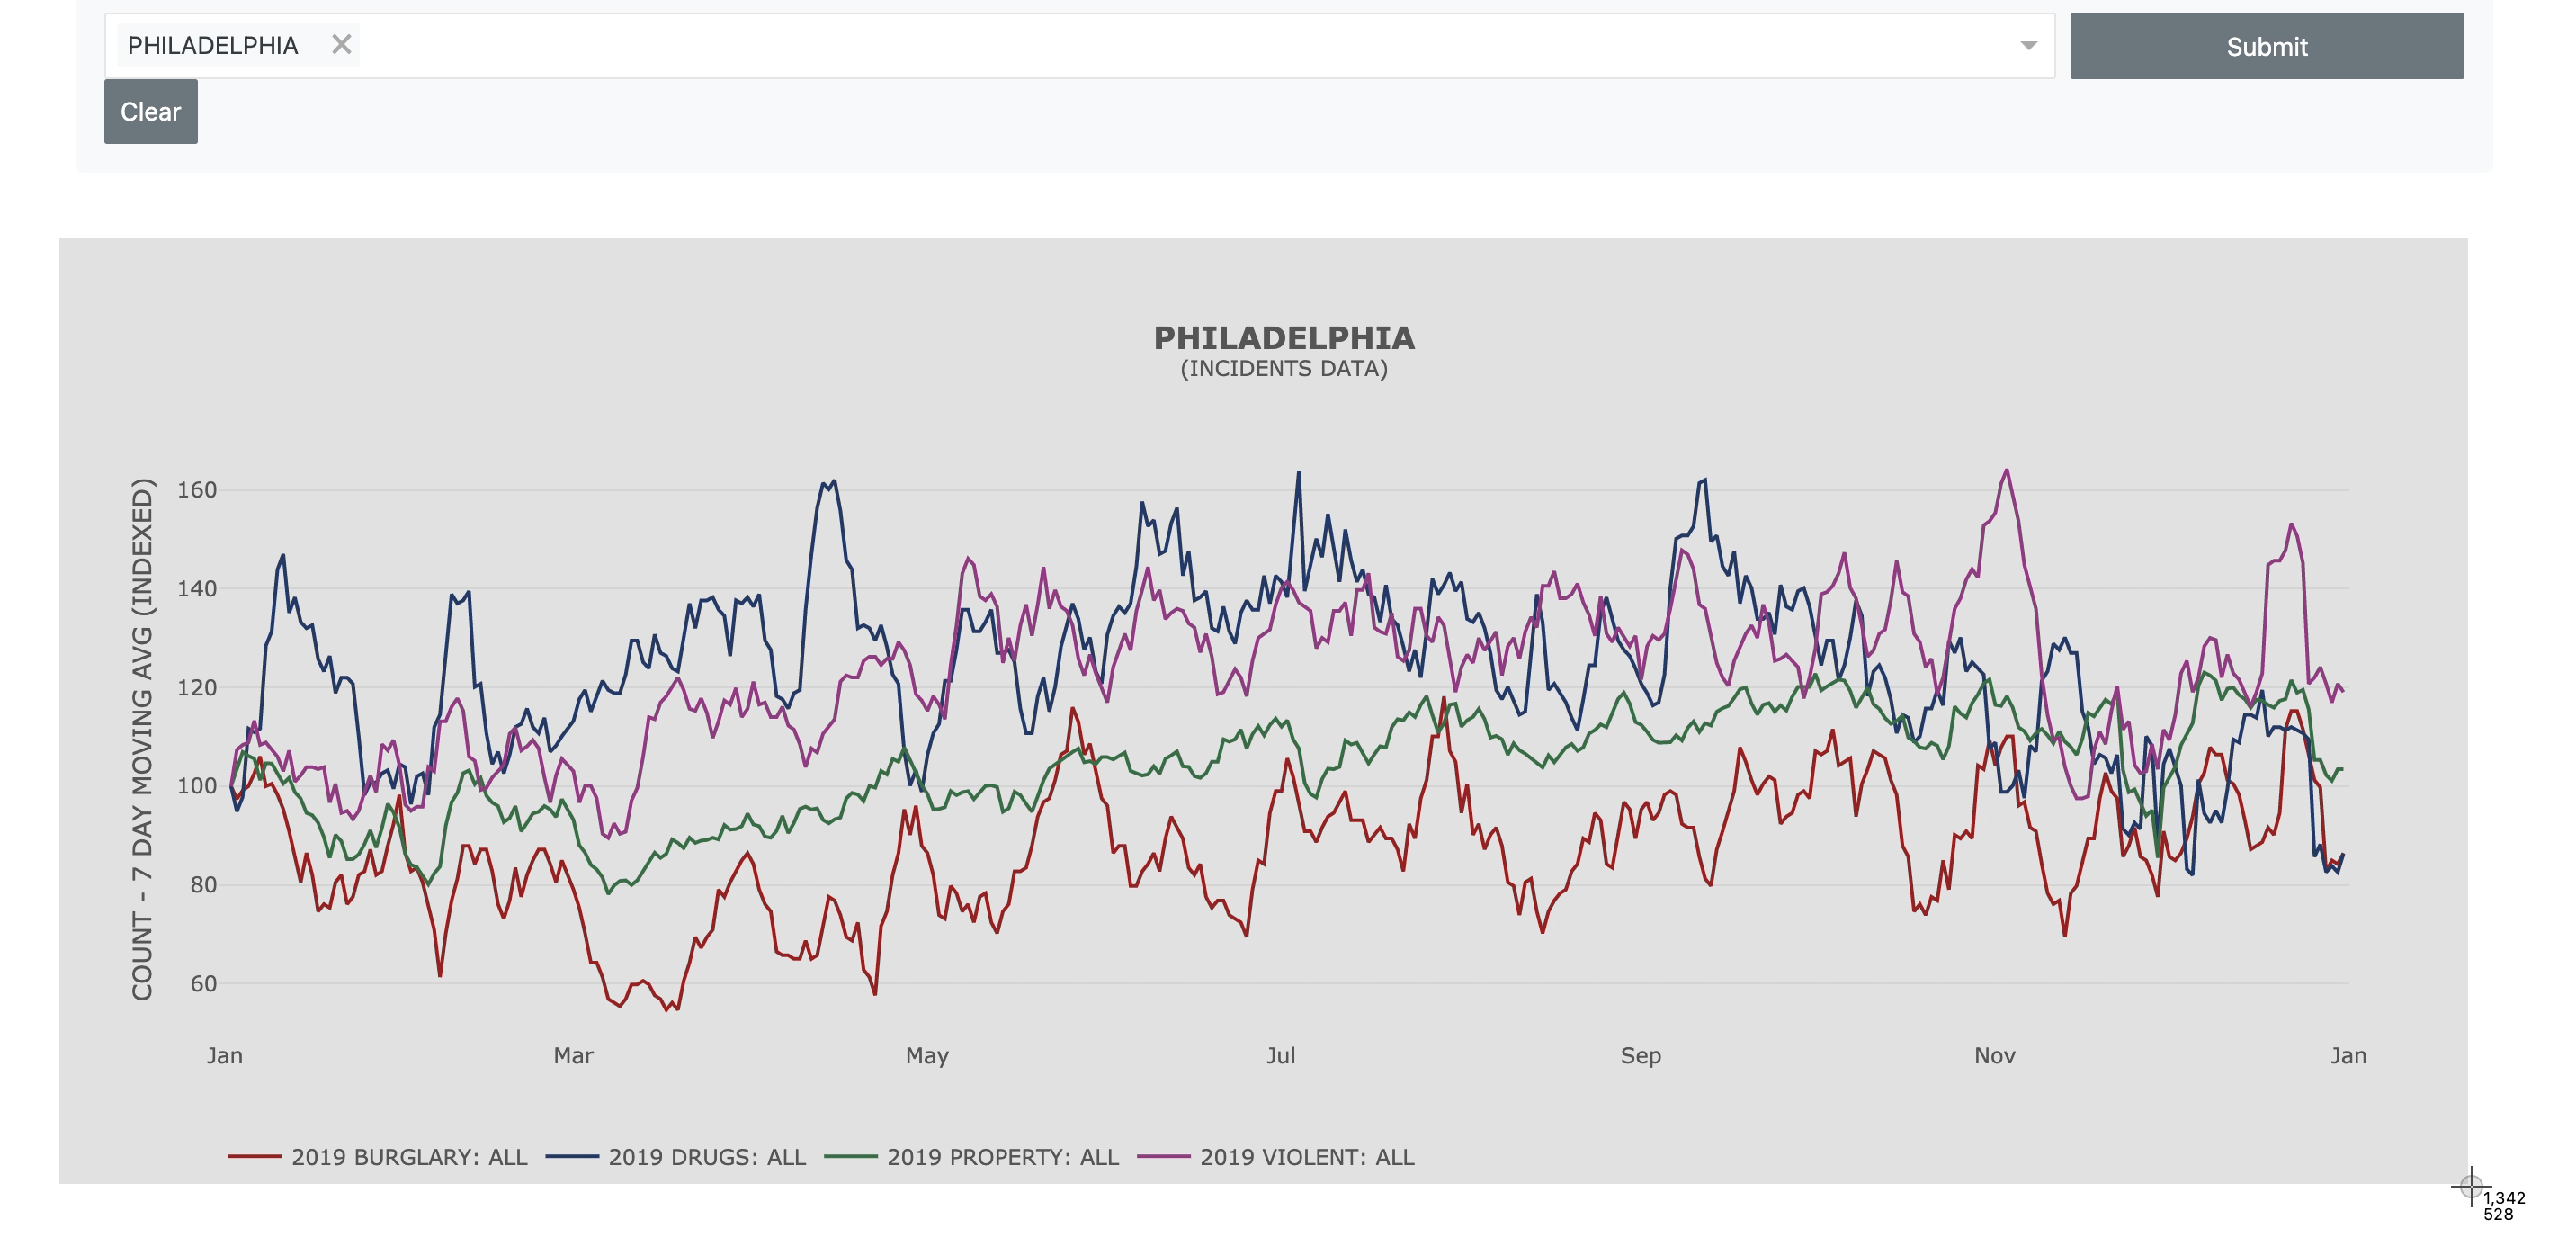
To see how types of crime in a city have changed relative to each other over a period of time, you can click on advanced settings and selected the indexed version of COUNT, which will normalize that year's data for each crime type at 100 based on the average of the first week. That is, all the lines for each crime type will start at 100, and fluctuations in the graph would indicate the relative change to that first week.
To zoom into the graph, simply click and drag an area over the graph into which you want to zoom. To exit from the zoomed-in graph, simply double-click anywhere on the graph.
A screenshot is the easiest way of downloading or saving the graph. On a Mac, hold the Command and Shift keys down, then press 4. Then, drag the resulting cursor across the area over which you intend to take a screenshot. On Windows, simply click the Print Screen (PrtScn) key on the top right of the keyboard.
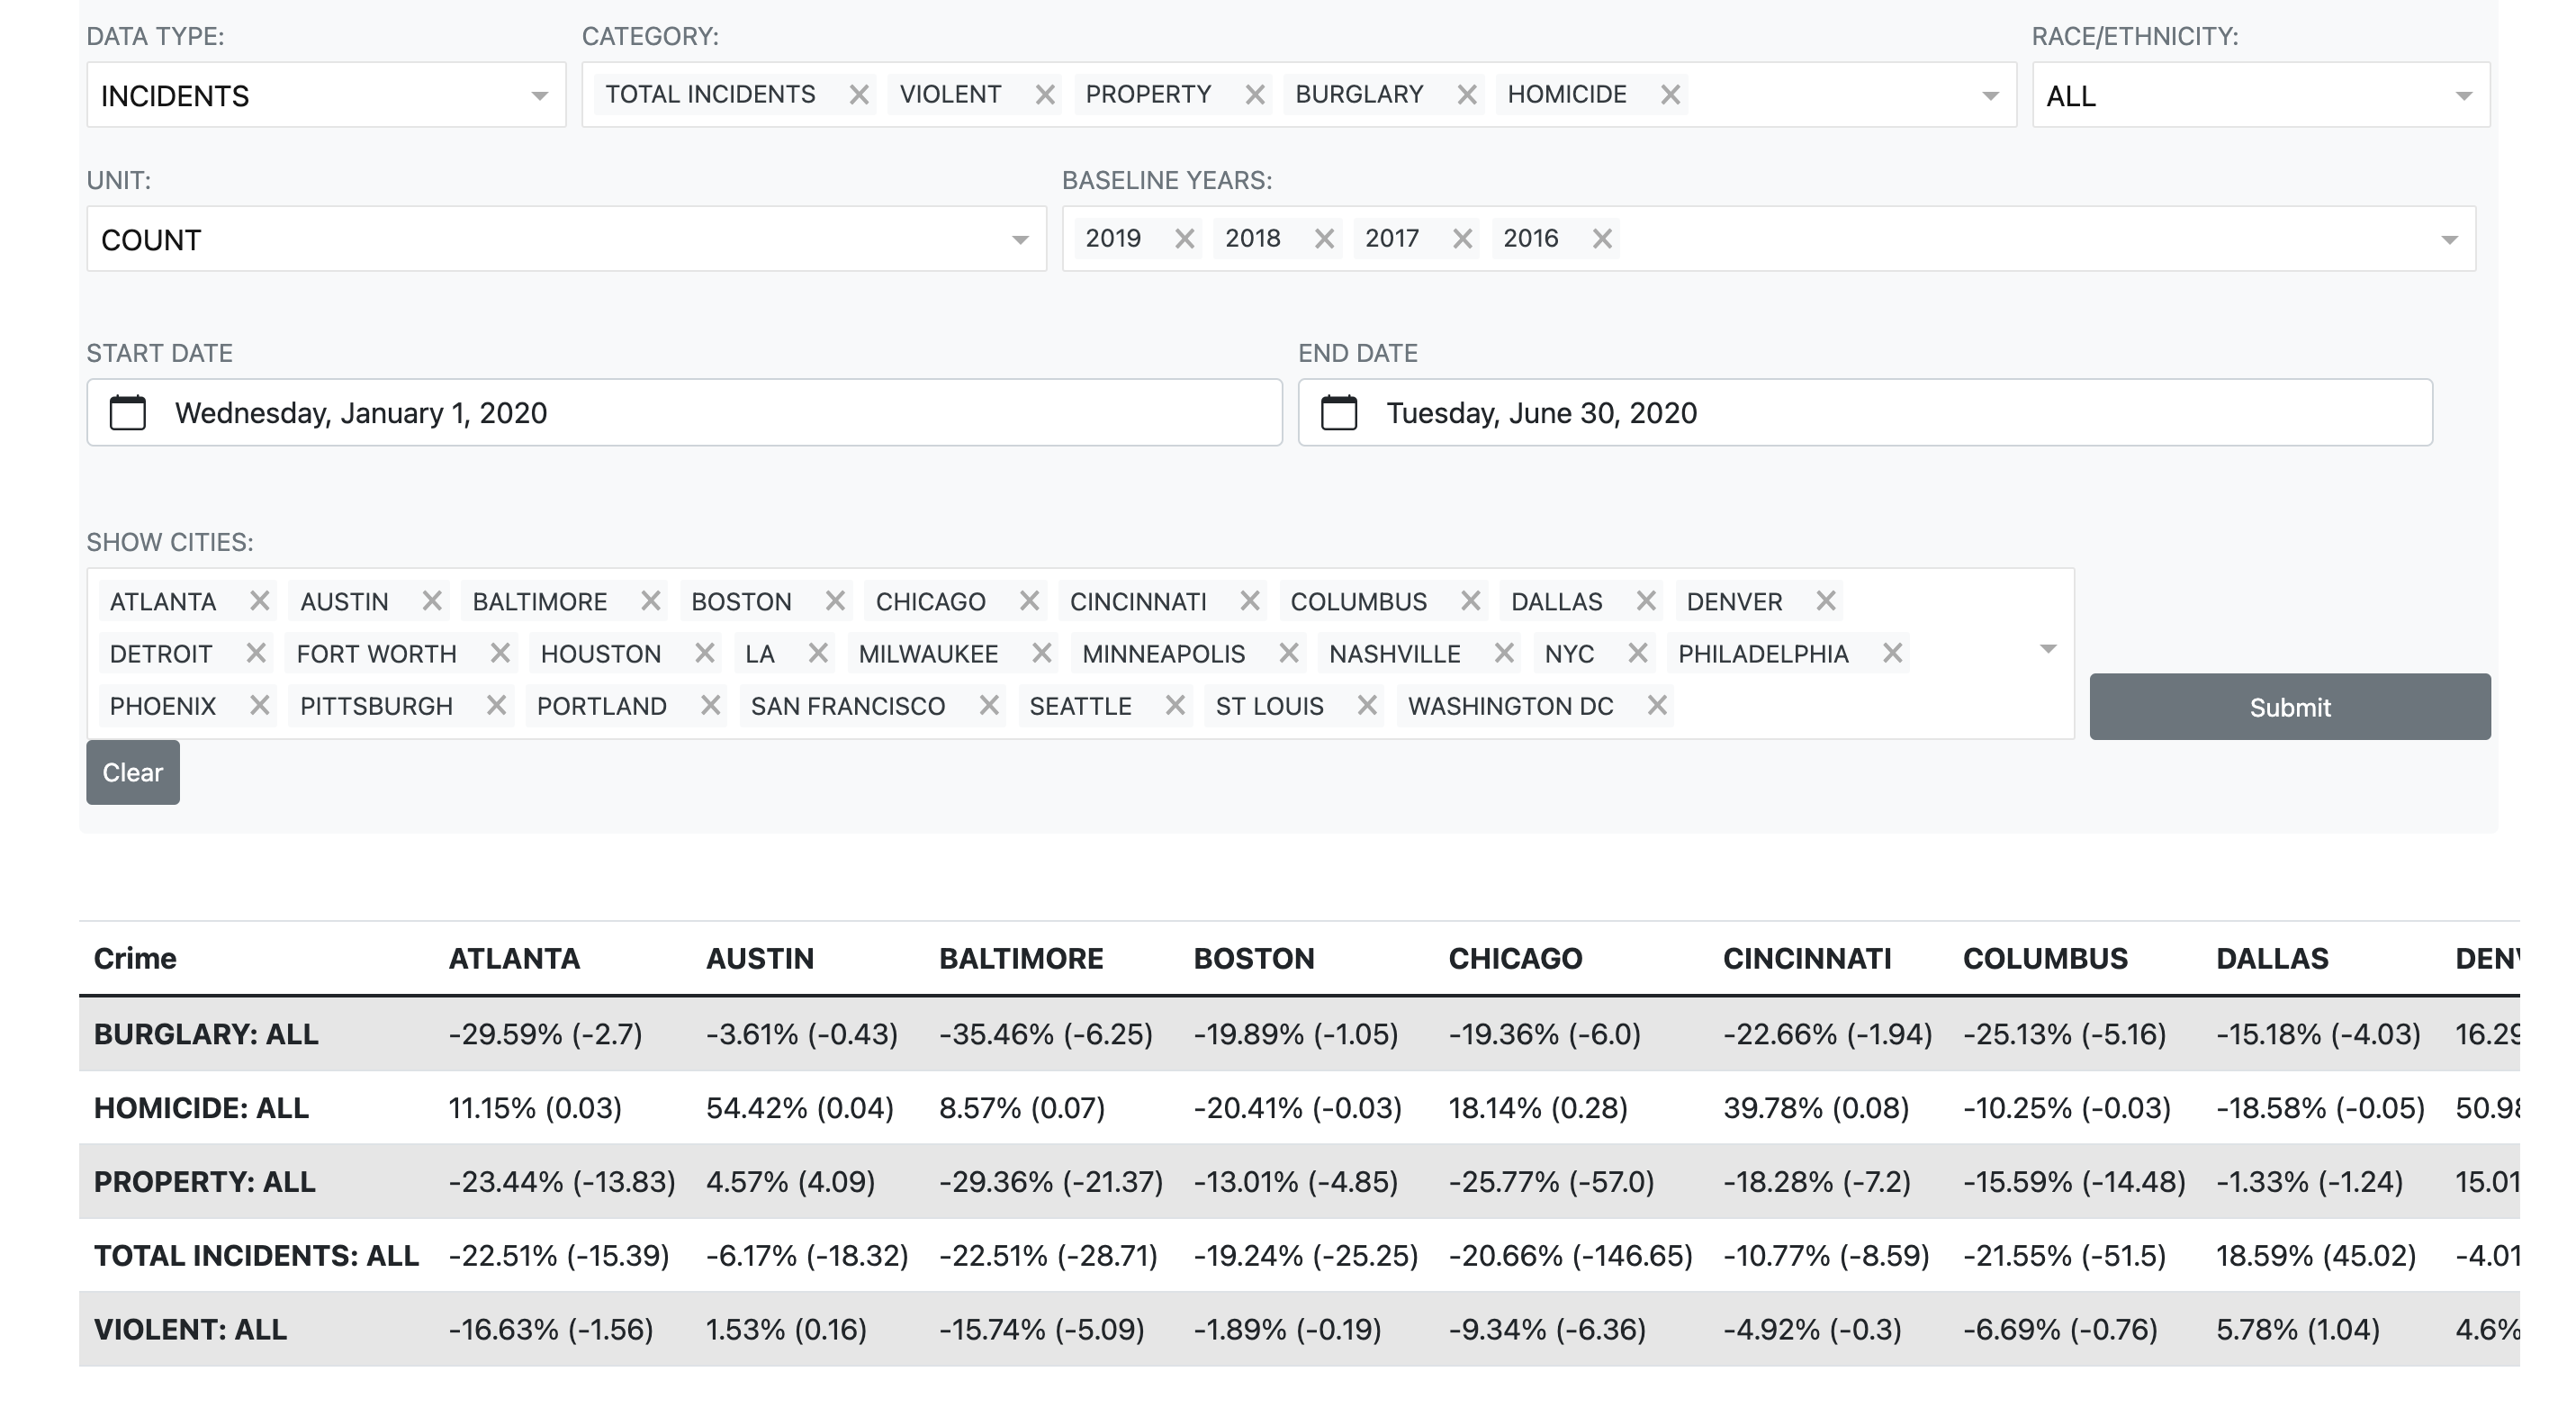
The statistics page will show percentage and overall changes in various types of crime for different cities. The date range selector will only allow you to select dates in the same year. If baseline year(s) are chosen, then the change in the average of the date range in the current year and the average of same date range in the baseline years is outputted. This way, seasonality is accounted for. The result is a table where the columns are cities and the rows are types of crime. Each cell has a percent change and an overall change, the latter of which is in parentheses. If baseline year(s) are not selected, the increase in crime from the start date to the end date is outputted instead. Missing table values either mean that data is unavailable for that city/crime or the range does not include any data.
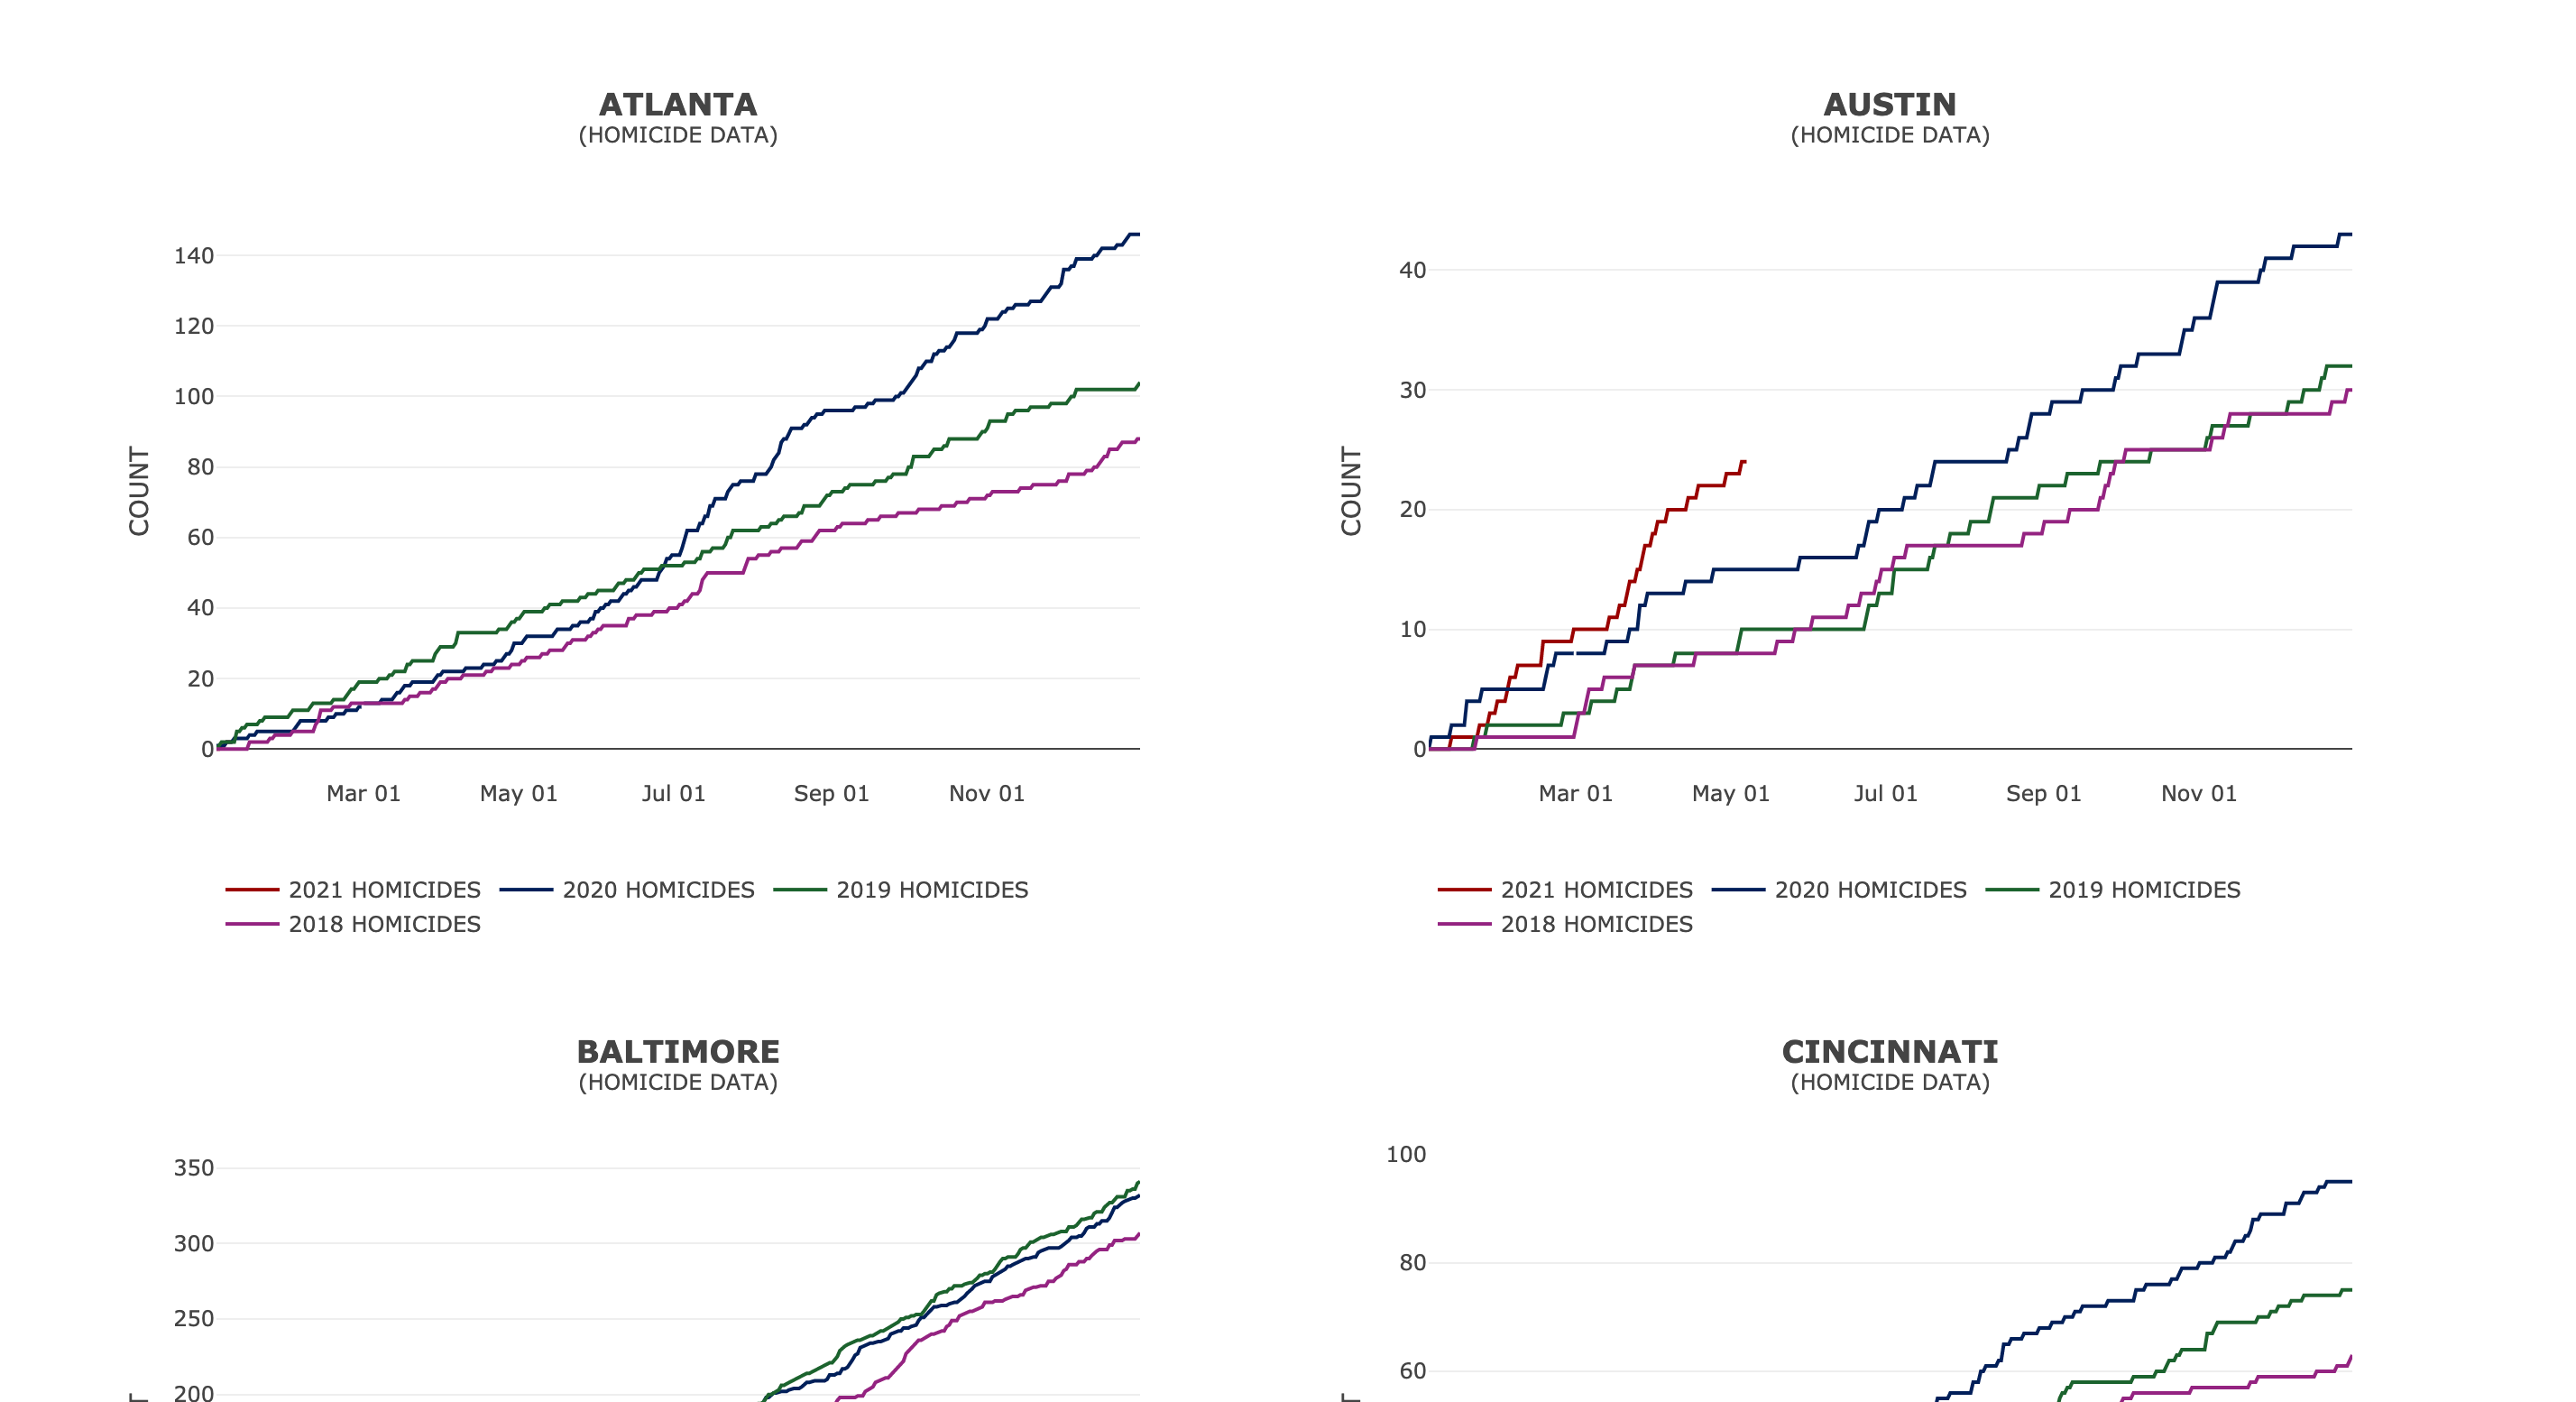
The homicides page displays specific data for just homicides. Instead of showing the number of homicides per day, the page instead shows the cumulative number of homicides in a selected year to better visualize the changes. Multiple years and multiple cities can be selected.
Data on this site comes from research led by David Abrams, with assistance from Priyanka Goonetilleke, Elizabeth Holmdahl and Bridget Brody. Please cite this URL when using figures or data. Site designed and built by Kathy Qian and David Feng.
To request access to the raw data used on this site please email David Abrams and Priyanka Goonetilleke